One of my passions is to support the people around me to achieve the best they can. Be that by simply providing a listening post to help answer questions in the form of Rubber Ducking, supporting tools that help developers build and validate code, through to providing “inspiration” for new ways of working.
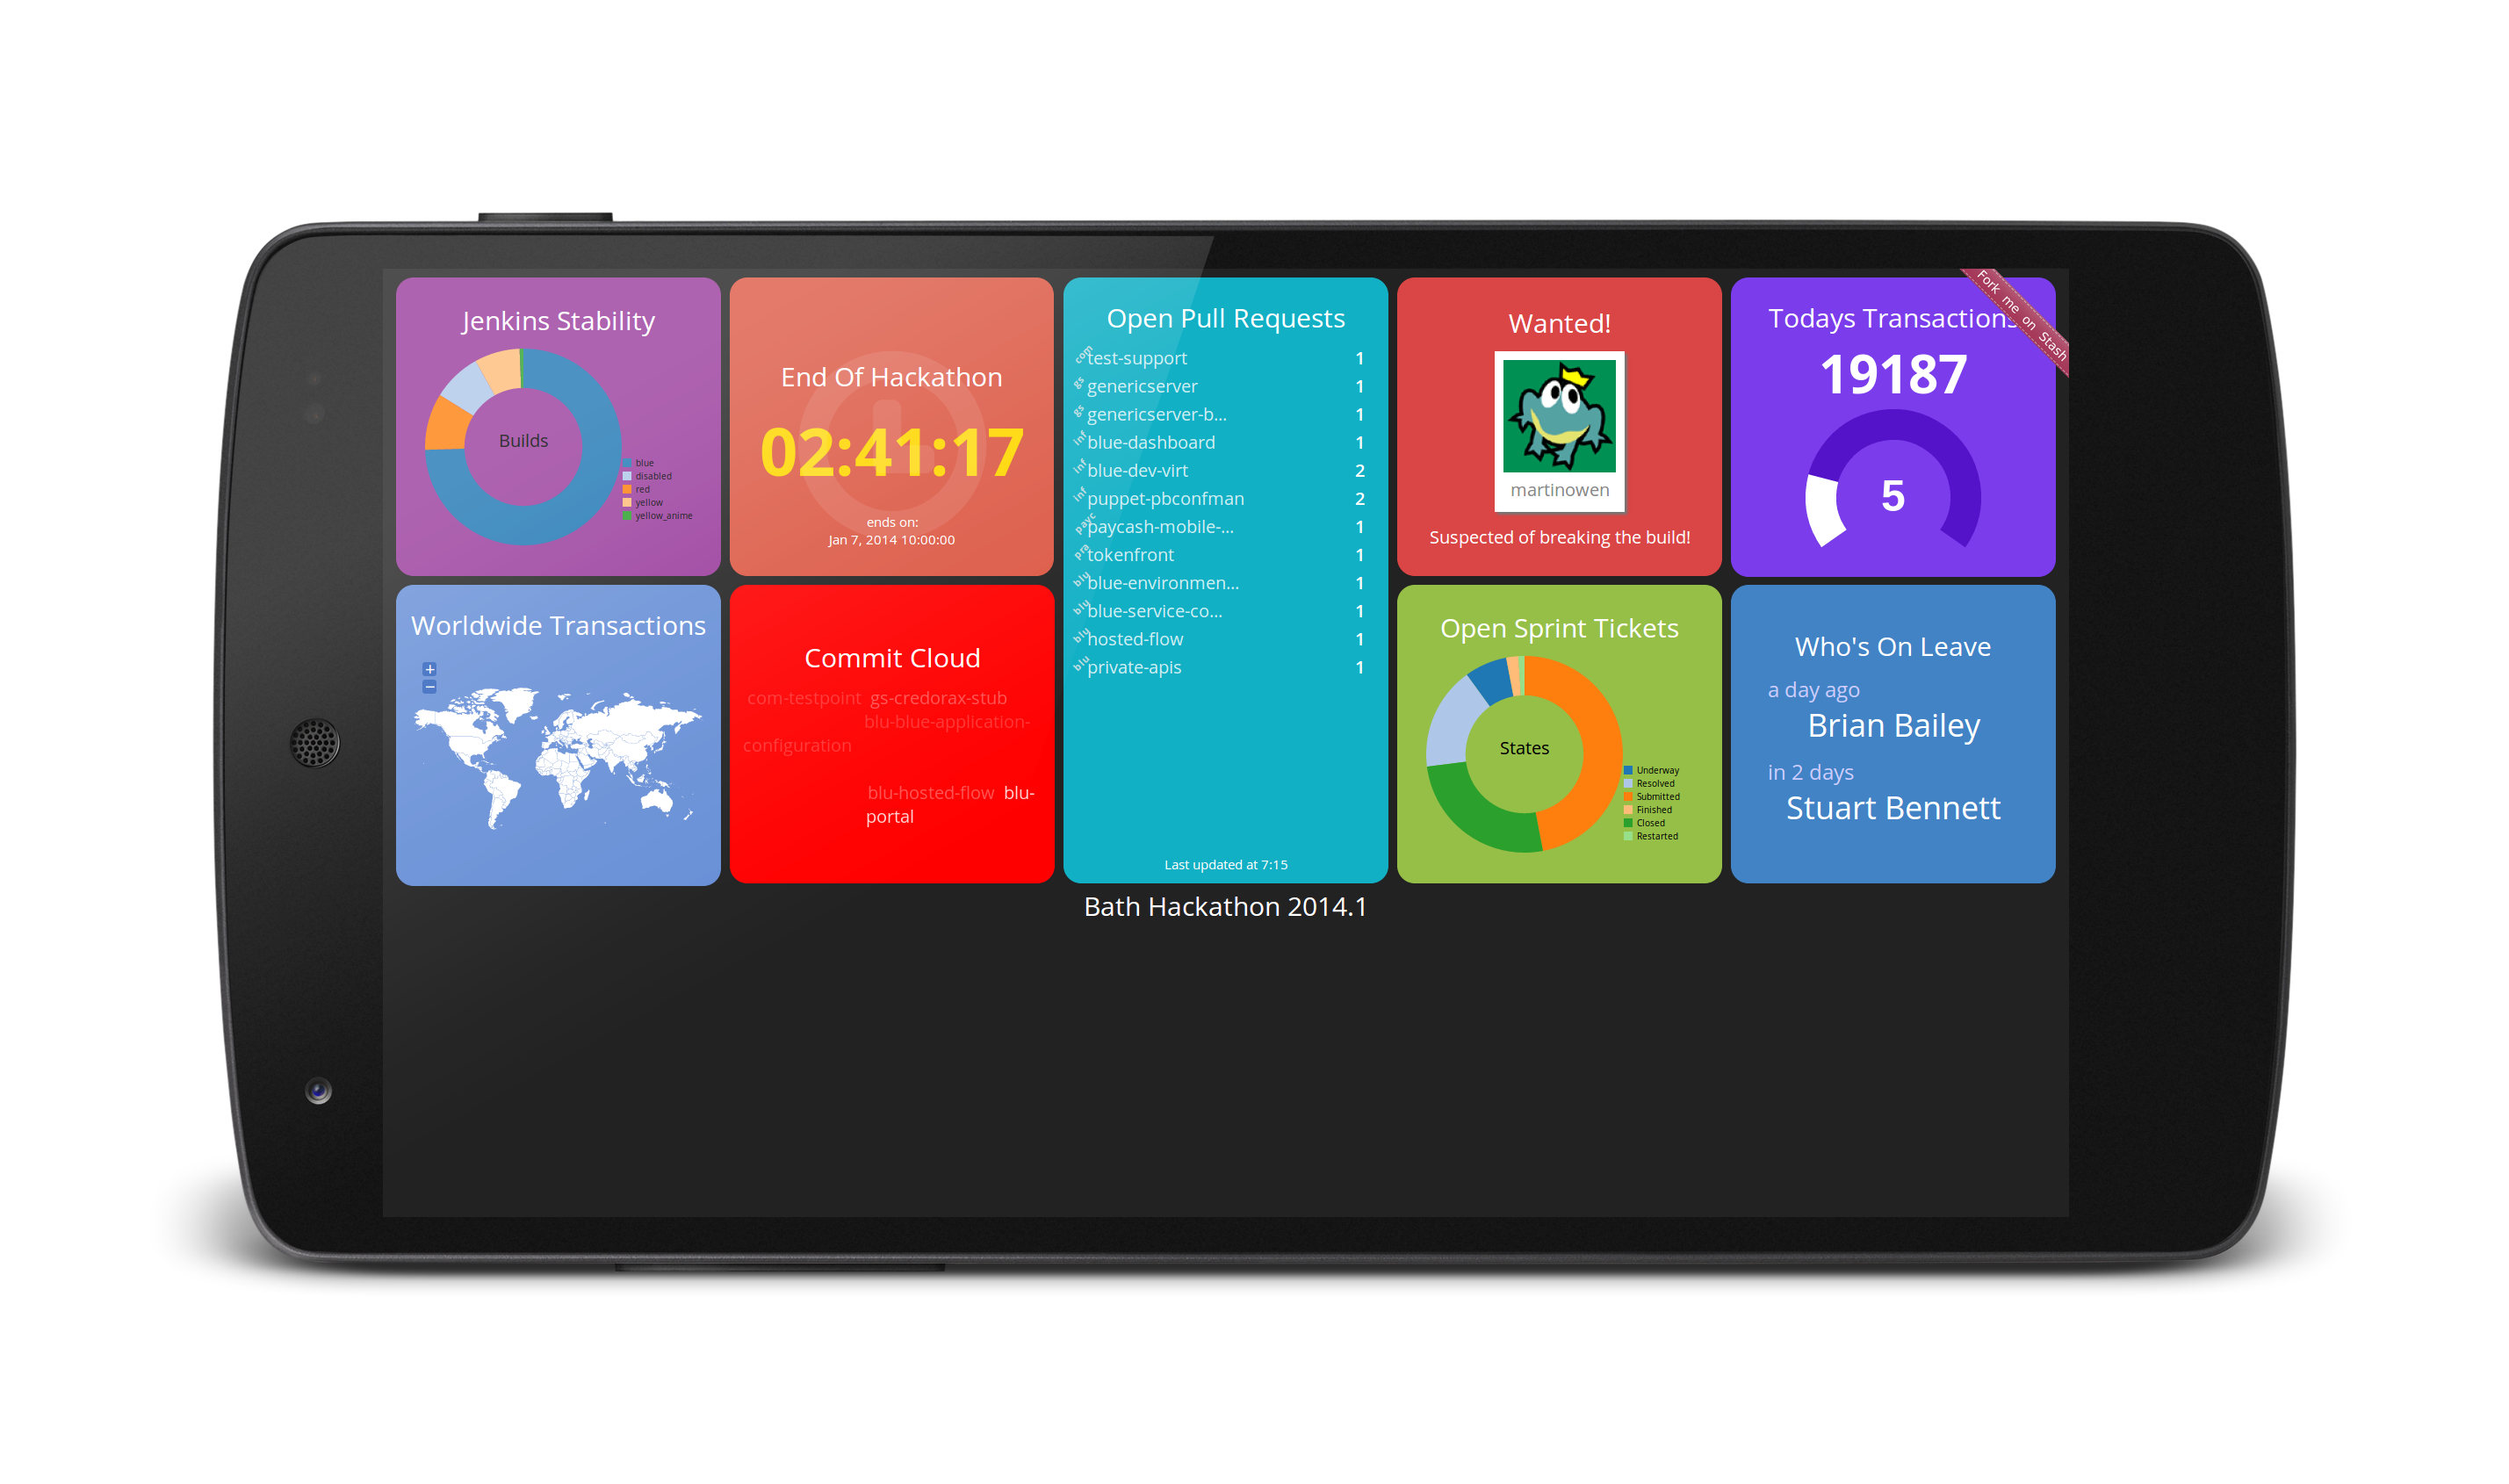
I’ve always been very interested in presenting information to users in innovative new ways, or perhaps finding innovative new data from the noise. An example of this was undertaken during a hackathon at PayPoint.net using a Raspberry Pi and an instance of Dashing to generate a wallboard for the team as a whole.
Retrospective
We ran the hackathon in early January as a relaxing way to get back into things after a long break over the new year, but after four months I thought it’d be interesting to write up a few of the lessons I learnt during this time.

Gather Yourself
I went into the hackathon with what I considered to be a pretty clear idea of what I was going to do. I wanted to create, using my RPi and Dashing a portal that can sit in the shared area of the office and present “at a glance” pieces of information that don’t require alot of understanding or interpretation to understand, that’d then spur additional questions and start a conversation.
The problem was, I didn’t take stock of what I was able to do with Dashing “out of the box”, and so spent considerable time making fairly elaborate new widgets and views only to decide they were cluttered, badly written or simply “didn’t work”, only to end up using some of the default widgets and simply populating the data from my background jobs.
Moral: Ask what your tools can do for you, not what you can do for your tools.
Take screenshots
I found that one of the most fascinating aspects of my experimenting was reviewing the screenshots I took during the event. Every so often, typically around the same time I made a significant git commit, i’d take a screenshot to commemorate my progress through the 24 hours. This was fabulous documentary evidence when it came to presenting my activities to the rest of the team as it allowed me to present my thinking, the evolution of the delivery and gave some meaning to the eventual delivery. I think it also helped demonstrate the work involved in creating elegant, minimalistic designs for customers.
Moral: Look to where you have been to see where you may go next
Release Soon, Release Often
Within the first half hour I was running the bare dashboard on a second monitor beside my desk, using a built in browser for the Pidori OS that I’d installed. This was a fantastic tool for myself in a number of ways.
Firstly it made people aware of what I was doing, the monitor was clearly visible from anywhere in the office and people were often coming over to see the progress I was making, and importantly making suggestions to how to shape the UX, additional data to consume, and starting to think about new ways to shape their own work, both in the hackathon but also in day to day development, that’d help bring this information out in the future.
The second brilliant thing about running it loud and proud was the quick feedback I obtained when I started pushing the little Raspberry too hard. Running a full GUI and browser, with quite alot of javascript and CSS takes a considerable amount of CPU, with pages often taking 15 seconds to render. This formed a significant part of my minimalisation of the UX and also highlighted quirks in the resolutions being used between my desktop and the monitor attached to the Pi.
Moral: If you show it, they will come. And sometimes bring the sprinkles.
Where are we now?
So four months on, what have we done?
Frankly, nothing. Its incredibly disappointing as the “front-end” components were basically delivered, but one of the hardest things I’ve found is getting data out of our systems in meaningful ways, and ways that don’t consume my whole working day to obtain. The monitor has been moved, the Pi has returned to my laboratory (i.e. my loft) and noone seems to have really noticed/cared.
Where next then?
Rather than end on a downer, I’m going to start kicking up a fuss once again. Martin Owen recently brought a Pi back from the API Conference held in Amsterdam, which has rekindled my interest in such a device. This coupled with some desires for some general ongoing statistics means I’m going to once again grabble with obtaining data from our systems, and representing back to the teams. So to start things off, heres my short list of stuff to start monitoring, recording, and presenting:
- Jenkins builds per hour
- List of CR’s due for completion in the next week
- Issues open per sprint team for current sprint
- I think this is considerably easier with the 6.x JIRA installation we’re now using - (I hope)
And because I’m still an experimenter at heart, and it may be another post:
- Cups of tea brewed today
- Set of scales - WH-B05
- Some MSP430 chips
- A couple of Nordic RF transceivers
- Some imagination
Wish me luck…